


We're excited to announce the first major revision to our TruePerformance valuation model in... well in a long time. There's a lot to cover here, so let's jump in.
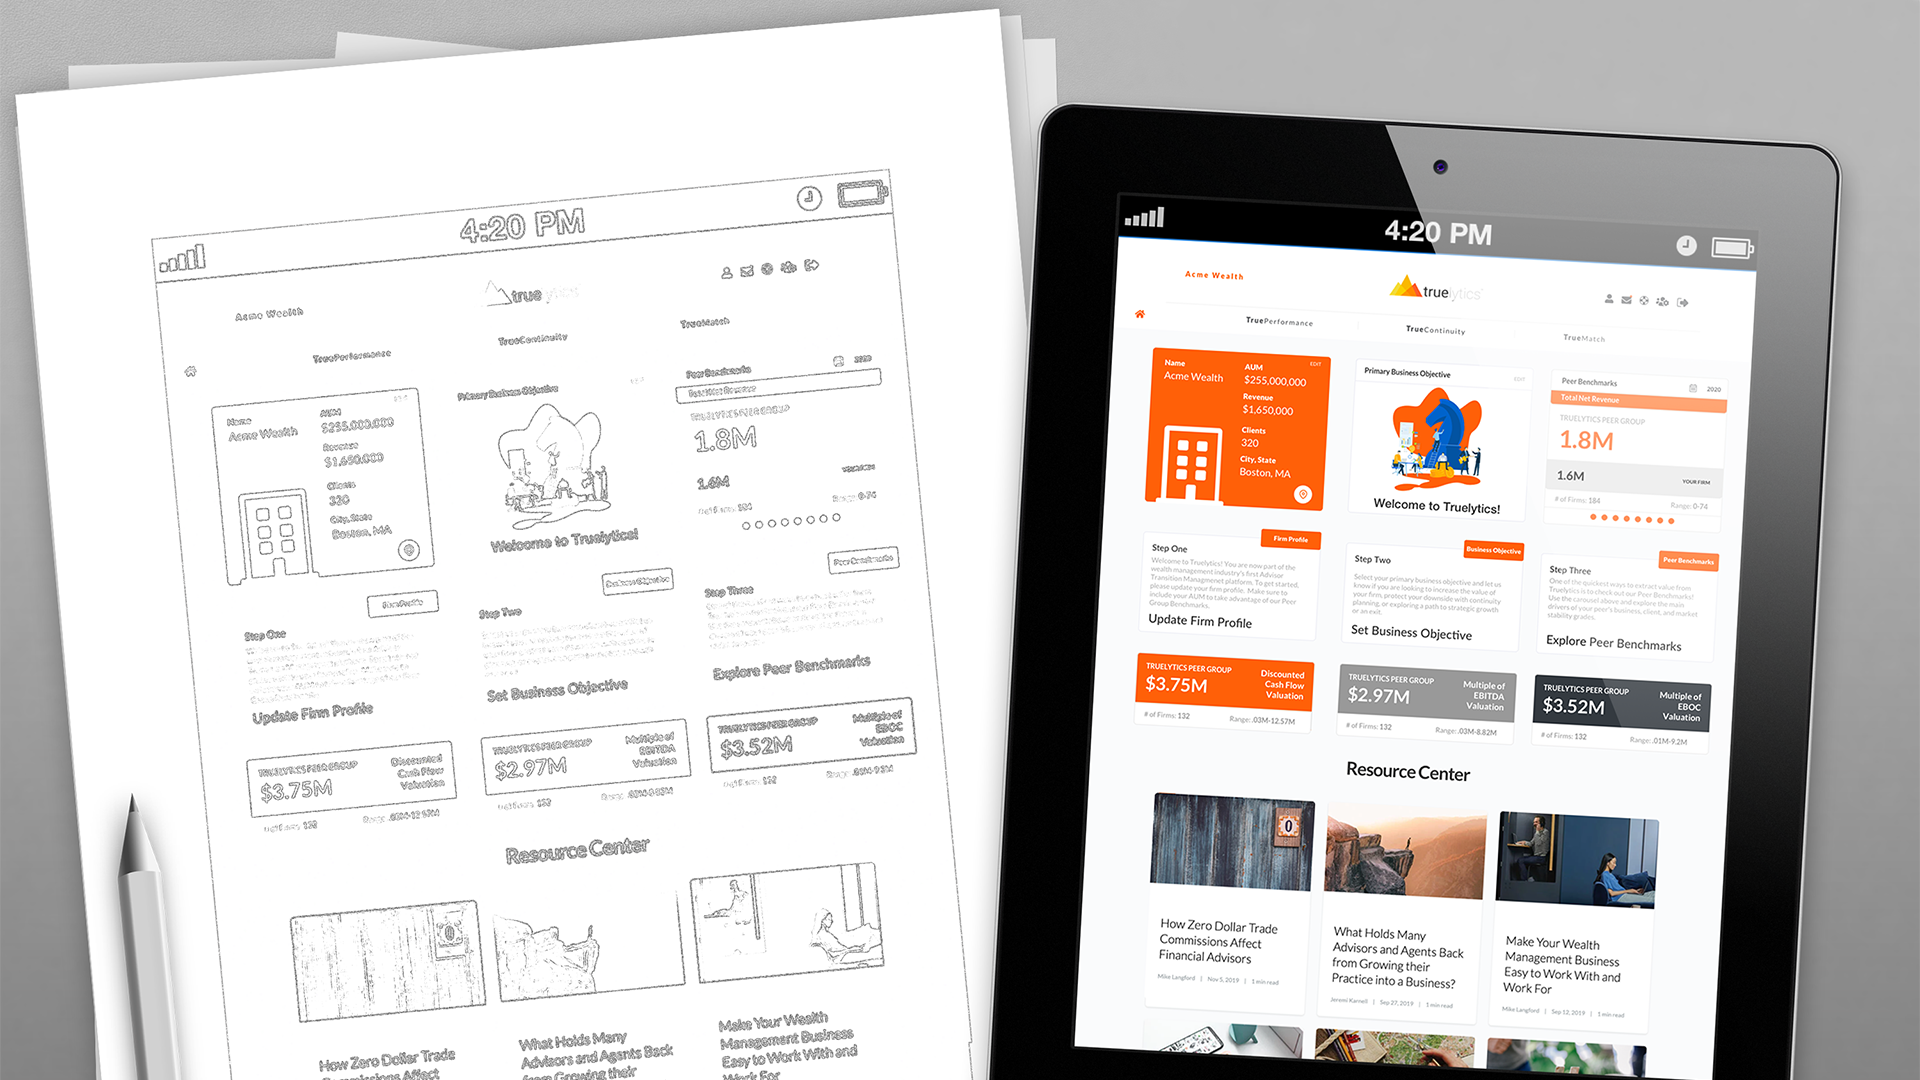
TruePerformance at its core can be broken down into two major components: The intake component, where we gather all the information we need; and the reporting component, where we show you what your data means. This latest update to TruePerformance has some important changes to both components that we're excited to show you.
Let's start with the intake component.
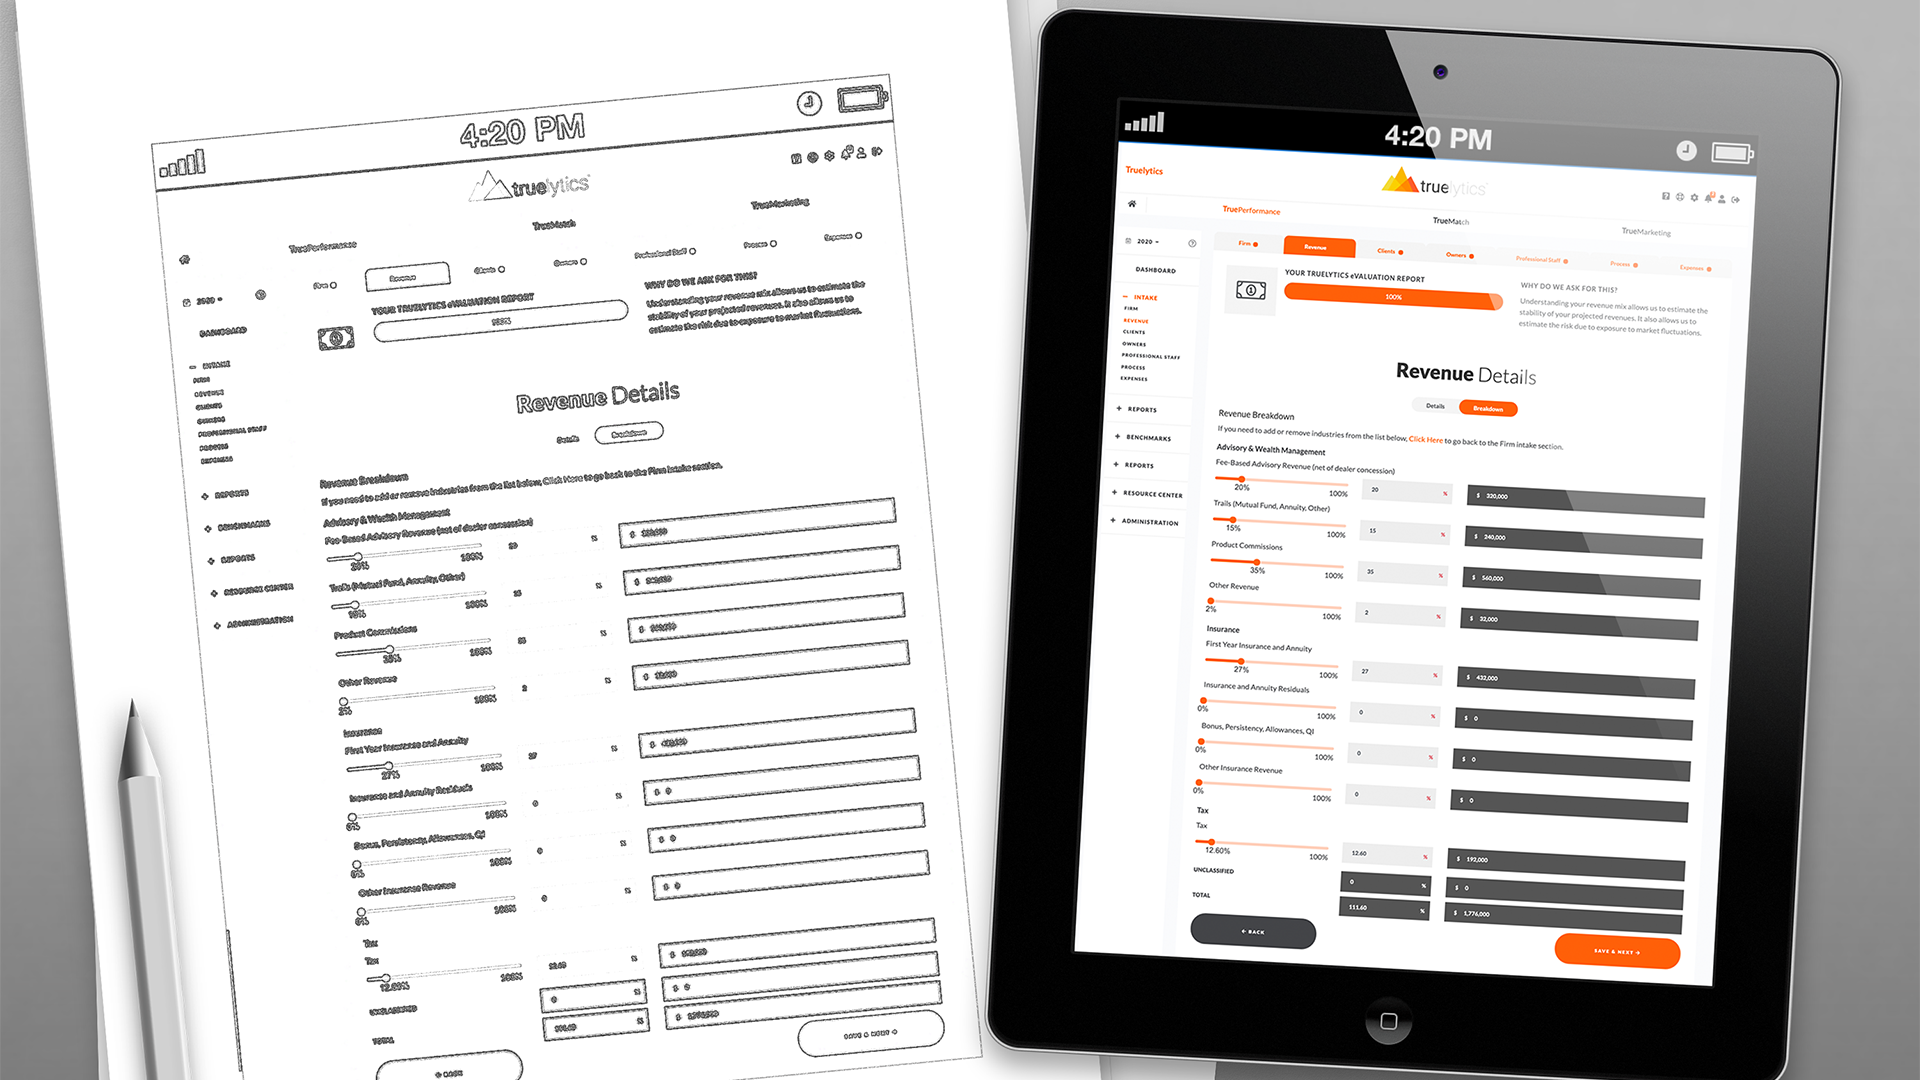
We've always asked for revenue breakdown by product. As we've grown and as we've taken feedback from our customers, we've learned that the categories we have today just aren't granular enough to capture the complexity of an advisor's revenue stream. So we took that feedback and went from this...

...to this...

Exciting stuff, right!? But just you wait. We're about to get to the really exciting stuff, and these product breakdown changes play a big role.
Market Stability, you've been good to us. We've shared some great times together. But it's time for us to move on. Don't get us wrong -- you're great! You showed us how our product mix affects our valuation through our risk premium; and that's awesome! But... we've grown and changed over the years. We've become more mature. Our Revenue Breakdown by Product just isn't what it was a few years ago. And as such, we're looking for someone a little more mature too. We're sorry!
And this is the part that's going to sting the most. We've found someone else: your big brother, Revenue Stability.
With Revenue Stability now in the picture, the product breakdown now only accounts for 25% of the new Revenue Stability score, whereas it used to account for 100% of the Market Stability score. The other 75% comes from other intake questions that were ever present in the intake but under represented in the valuation model -- questions from the Investment Process intake section such as:
These changes bring Revenue Stability up to the same features and level of clarity as we've always had with the Business Stability and Client Stability. Don't believe me? Here's a screenshot to prove it!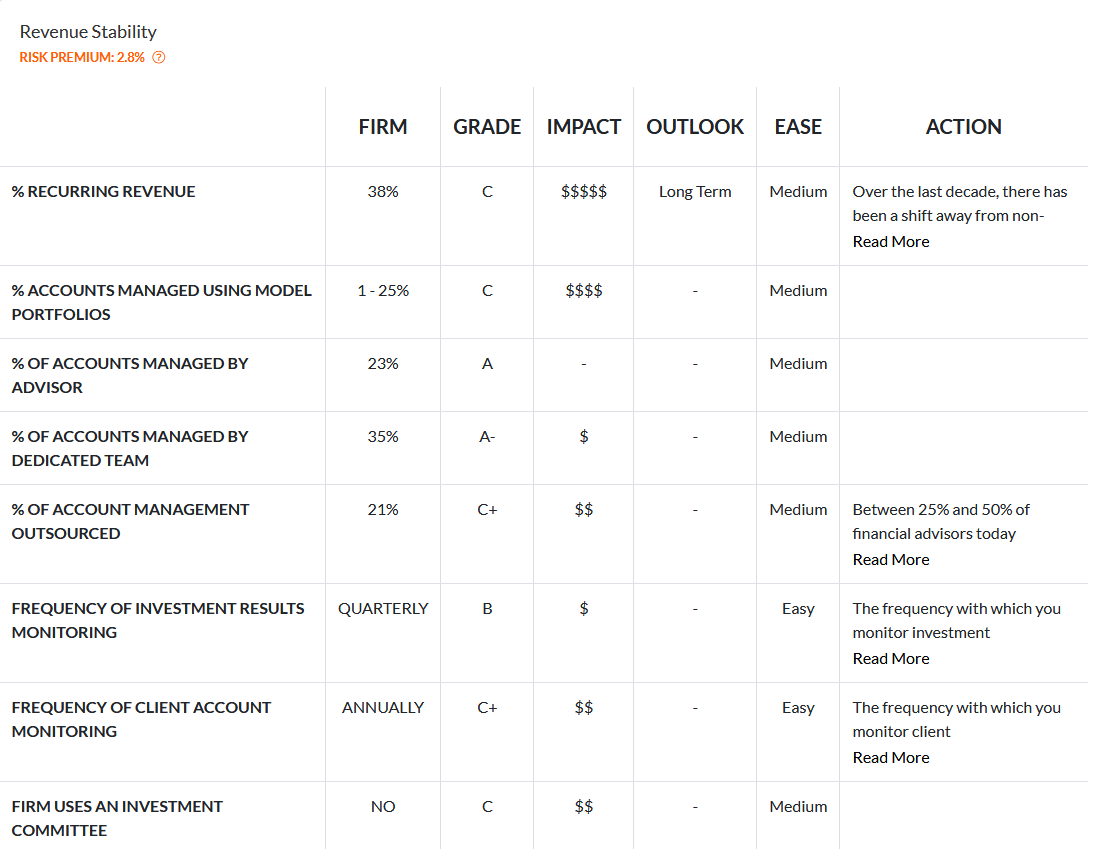
Impressive, I know.
"But wait, Eli..." you might be saying to yourself, "what are all those new columns on the scorecard pages?" I'm glad you asked.
To make all three scorecards (Business Stability, Client Stability, and Revenue Stability) even better, we've added a few new features to our KPIs.
That's a wrap! We hope you enjoy the new features.
As always, if you think there’s something that you’d like to see, please feel free to reach out and let us know.